Everyone had an AQI number to say but no two voices were the same.
Why every app, pollution board and Instagram page gave a different answer for the same air this Diwali, how the number is actually made, and what our sensors in Jammu, Kashmir and Ladakh recorded.
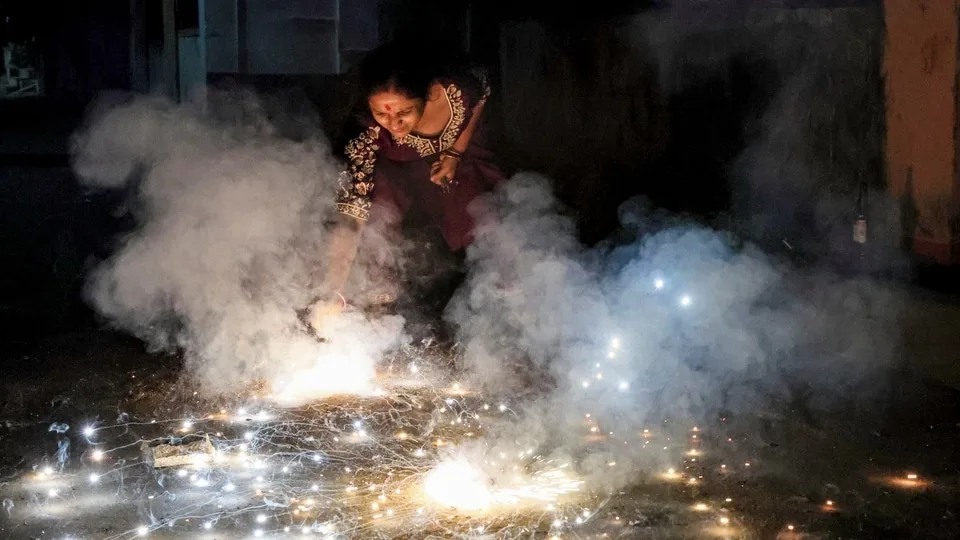
Sometime around 9 pm on 8 November (Diwali night), screenshots started going around with numbers most people had never seen on an AQI app before. By 9 pm, AQI.in had six Indian cities above 1000, with Sri Ganganagar at 1131 and Chennai at 1119. Over the next couple of days, screenshots of Apple Weather showing 1290 for Bengaluru got answered with screenshots of other apps showing 166 for the same city at the same time, and each side accused the other of spreading misinformation. A big Instagram page posted "India's 10 least polluted cities" with Srinagar at the top, AQI 19, "Good", and it got close to twelve thousand likes. Closer to home, the arguments about whether Diwali was the problem went on for days, in local subreddits, in group chats, and probably at a few dinner tables.
Everyone had an AQI and nobody had the same one. The strange part is that most of them weren't lying, exactly. They were answering different questions with the same three letters.
Here's what that looks like on two phones, in the same city, at the same minute.
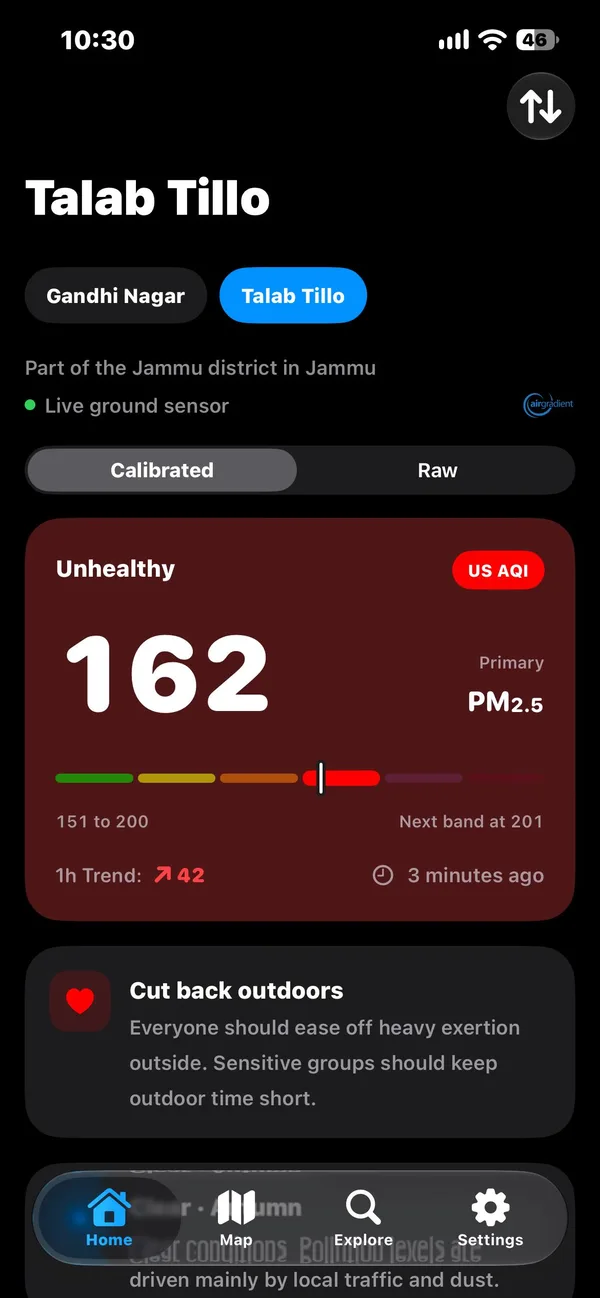
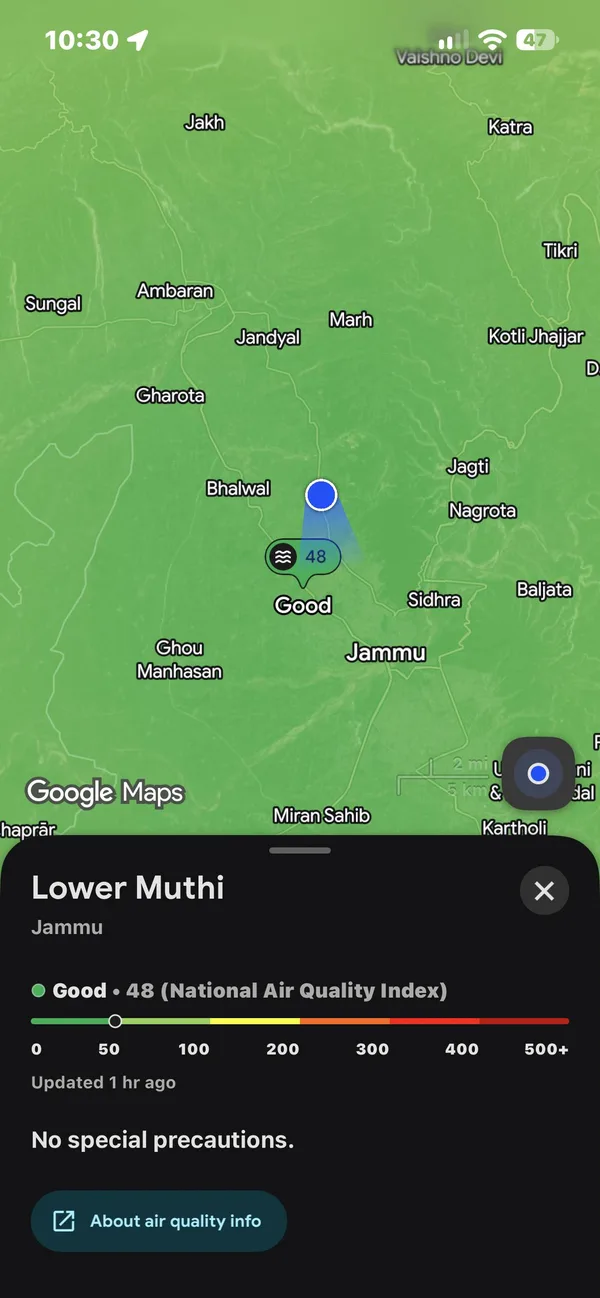
This is a long one (sorry). I'm going to go through what the number actually is, how it gets measured, how much of it ends up in your body, why every app shows you something different, what the government does (and doesn't) publish for Jammu, Kashmir and Ladakh, and then what our own sensors recorded around Diwali, including the bits that don't make anyone in those arguments completely happy. There are a few things you can play with along the way, so if you only want to poke at those, go ahead. Every number here comes either from our own sensors, which are public through our API, or from a source that's linked right next to it.
What's actually in the air
When people say "the AQI is bad", they almost always mean particles. PM10 is anything smaller than 10 micrometres across (road dust, construction dust, pollen, the stuff you can sometimes see), and PM2.5 is anything smaller than 2.5 micrometres, which is roughly thirty times thinner than a human hair. There's a lot of overlap between the two, since every PM2.5 particle is also, by definition, a PM10 particle. Most PM2.5 comes from burning things, so engines, wood, coal, leaves, rubbish, and yes, crackers.
PM2.5 is the one that does most of the damage. Particles that small get past your nose and throat, settle deep in your lungs, and the smallest of them make it into your blood, which is why the WHO links them to heart disease as well as lung disease (WHO guidelines, 2021). It isn't only a long-term thing either. A 2024 study in The Lancet Planetary Health looked at ten Indian cities between 2008 and 2019 and found that every 10 µg/m³ rise in the two-day average of PM2.5 came with 1.4% more deaths that day, and that about 7.2% of all deaths in those cities (around 33,000 a year) were tied to PM2.5 above the WHO's daily guideline. The risk rose fastest at the lower end, which means even a "moderate" day isn't free.
The other gases (nitrogen dioxide, sulphur dioxide, ozone, carbon monoxide) are part of the official index too, and they come up again later, but for this post, when I say "the air", I mostly mean PM2.5. I went through why it gets so much worse here in winter in the last post, so I won't repeat that. This post is about the next step, which is how a concentration in µg/m³ gets turned into a single number on your screen.
How a number becomes an AQI
An AQI is a translation. You take a concentration (how many micrograms of particles are in a cubic metre of air), you pick how long to average it over, and you look it up in a table. Each row of the table covers a range of concentrations and a matching range of AQI, and has a name and a colour.
The easiest way to picture one row is two rulers laid side by side. The top ruler is the concentration, the bottom one is the AQI. You find your reading on the top ruler and read off whatever sits right under it.
Say the sensor reads 90 µg/m³. In the US EPA's table, 90 falls in the "Unhealthy" row, which runs from 55.5 to 125.4 µg/m³ on the top ruler and from 151 to 200 on the bottom one.
How far along the top ruler is 90? Take how far it is past the start of the row, and divide by how long the row is.
So 90 is just about half way along.
Go the same distance along the bottom ruler, starting from its first number.
90 µg/m³ is an AQI of 175, "Unhealthy".
That's all an AQI is. Every app, every board and every country does this same thing. They just use different rulers.
India's table (CPCB, 2015) has different rows. In India, 61 to 90 µg/m³ maps to 101 to 200, so the same 90 µg/m³ comes out as an AQI of 200, "Moderate". Same air, same number of particles in your lungs, and one country calls it unhealthy while the other calls it moderate. India's daily limit for PM2.5 is 60 µg/m³, the US EPA's is 35, and the WHO recommends 15 (2021 guidelines). We use the EPA's table across BreatheOSS because it's the stricter one, and because the 2024 update to it is based on newer health research.
Now look at the bottom of both tables. The EPA's last row ends at 325.4 µg/m³, which is an AQI of 500. Anything above that, the EPA calls "Beyond the AQI" and stops counting. India's last row ends at 380 µg/m³, also 500. So where does 1000 come from?
Somebody keeps drawing the last line. We went through six months of AQI.in's data from one of its sensors in Jammu, and its "US AQI" above 500 is just the EPA's last row extended in a straight line forever. By that rule, an AQI of 1000 is about 576 µg/m³, and our worst 15 minutes in Jammu on Diwali (764 µg/m³ averaged across the city, more on that later) would show up as roughly 1380. The air is real. The scale past 500 is something an app made up, and different apps make it up differently, which is part of how Apple can show 1290 for a city where AQI.in shows 166.
On 10 November, CPCB put out a statement defending its own cap (The Tribune). It said 500 is the top of the scale on purpose (everything above it is "Severe" anyway, so a bigger number wouldn't change the health advice), that the gap with private apps comes from "variations in measurement techniques and averaging periods, and not under-reporting", and one more thing that's easy to miss. Its particle analysers were installed in 2015 and calibrated for 0 to 1000 µg/m³, and any hourly reading above that range gets thrown out by automatic validation. On the worst nights of the year, the official network literally drops the worst hours. CPCB says it's reviewing this.
I actually think the cap is defensible as a label. Once you're past 500 there isn't a worse colour to paint the map, and "Severe" already means stay indoors. What isn't defensible is losing the measurement underneath it. A cap on the index is a design choice, but a cap on the data is just a hole.
Here's the whole thing in one place, with one more yardstick from Berkeley Earth, which worked out that breathing 22 µg/m³ of PM2.5 for a day is roughly as bad for you as smoking one cigarette. It's a rough rule, but it puts the numbers in a shape people understand. Drag the slider, or tap one of the real readings from this month.
Fifteen minutes, or twenty-four hours?
The other half of the disagreement is time. India's AQI (and the EPA's) is defined on a 24-hour average for PM2.5, because the health research behind those tables is about whole days of breathing. A lot of apps take a single recent reading and push it through the same 24-hour table anyway. We checked this for AQI.in, and its "US AQI" matches the EPA formula applied to the raw reading at that moment almost exactly (the median difference was 0.19).
Neither of these is wrong, they're just different questions. "What's the air like right now?" and "how bad was the last day of breathing?" give very different answers on a night like Diwali. At Gandhi Nagar in Jammu, the worst 15-minute reading was 861 µg/m³, at 8:30 pm. Averaged over an hour, the worst you'd see is 605. Over 8 hours it's 342, at 1:15 am. Over 24 hours, the way CPCB does it, the number peaks at 184... at 5:15 pm the next day, long after the smoke had gone. At 8:30 pm on Diwali itself, while the air outside was at its worst, the 24-hour average still said 114.
Switch between them here. This is our real data for that week.
So when someone posts a 1000 and someone else posts a 200 "from the official site", they can both be looking at the same air through different windows. The 1000 is what you breathed for a few minutes. The 200 is what you breathed on average over a day. If you want to know whether to go outside right now, you want the short window. If you want to know how hard your lungs worked this week, you want the long one. The problem is that both get called "the AQI", and both get screenshotted without saying which one they are.
How much air is "a lot"?
There's a step most AQI arguments skip, which is that your body doesn't care about the index at all. It cares about how much stuff actually went in. That depends on three things, the concentration, how long you were in it, and how hard you were breathing.
The US EPA keeps a big reference of how much air people breathe (Exposure Factors Handbook), and the numbers are useful to know. An adult breathes about 16 cubic metres of air in a day. Sitting still, it's about a quarter of a cubic metre an hour. Standing around or walking slowly, it's about 0.72. Running or cycling, it's somewhere around 1.6. So here's Diwali evening, done the same way as the AQI maths earlier:
How much air did you breathe? Standing around watching crackers is light activity, about 0.72 m³ an hour.
How much PM2.5 came with it? The air averaged about 500 µg/m³ that evening.
Compare it with a whole day of air at the WHO guideline, and with an ordinary early November day in Jammu, at 16 m³ of air a day.
That evening is about 6 WHO-days of PM2.5. An ordinary day in Jammu right now is about 8.
Four hours on a terrace on Diwali night put about six WHO-days of PM2.5 into you. That sounds awful, and it is. But look at the line under it. An ordinary day in Jammu in early November, with no crackers anywhere, is about eight WHO-days, every day, for weeks. That comparison is going to come up again, so keep it in your head.
Try your own.
One thing this doesn't account for is being indoors. Outdoor air leaks into houses, and on a night like Diwali the inside of most homes in Jammu won't be anywhere near as bad as the street, but it won't be clean either. We don't have indoor sensors, so I can't give you a number for that, and I'd rather not make one up.
How a sensor actually sees particles
There are basically two ways to weigh something you can't see.
The slow, careful way is to suck air through a filter for 24 hours (the US reference method pulls 16.7 litres a minute) and then weigh the filter on a very precise balance (Aarhus University's explainer). It's accurate, it takes a day per number, and somebody has to physically swap the filter. CPCB's continuous stations mostly use a cousin of this called beta attenuation, where particles collect on a strip of filter tape and the machine measures how much beta radiation they block. That gives you a number every hour (EPA).
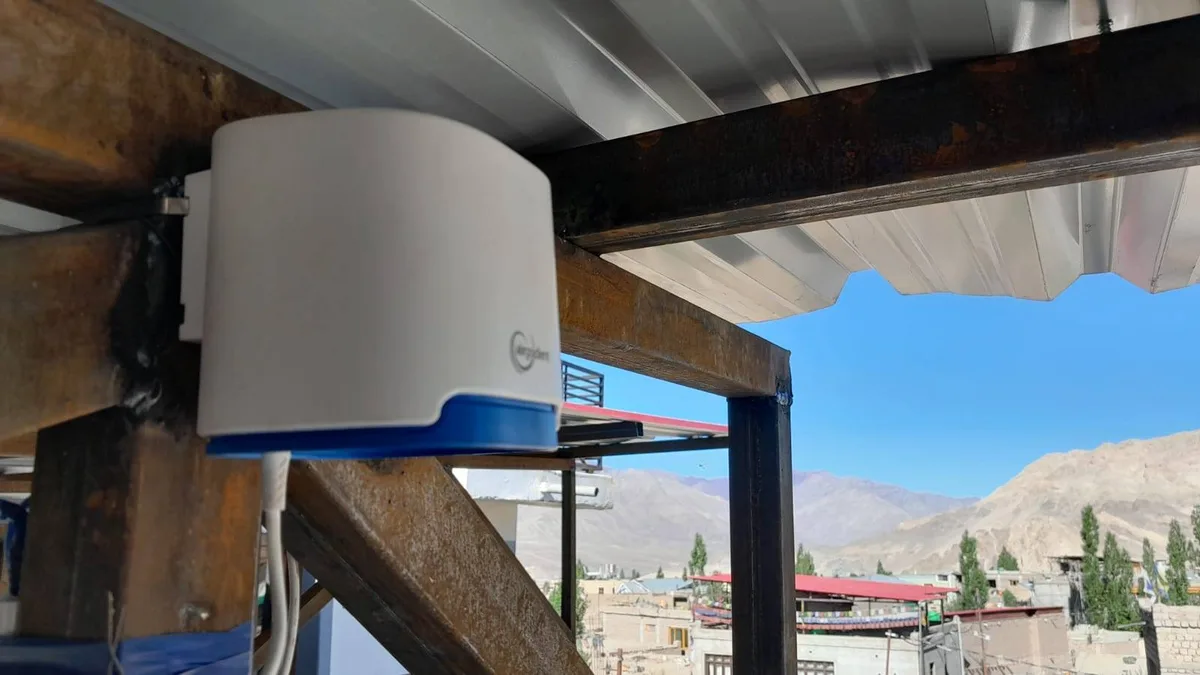
The cheap, fast way is light. Our sensors are AirGradient Open Air monitors, which use a Plantower laser sensor inside (so do PurpleAir, and most of the "ground sensors" you see on apps). A small fan pulls air through a chamber, a laser shines across it, and every particle that passes through scatters a tiny flash of light onto a photodiode. The sensor counts the flashes and sorts them by brightness, which tells it roughly how big each particle is. Then it guesses the weight, assuming every particle has a certain density and shape. It does this every second, for a tiny fraction of what a reference monitor costs, and that guess is where all the trouble comes from.
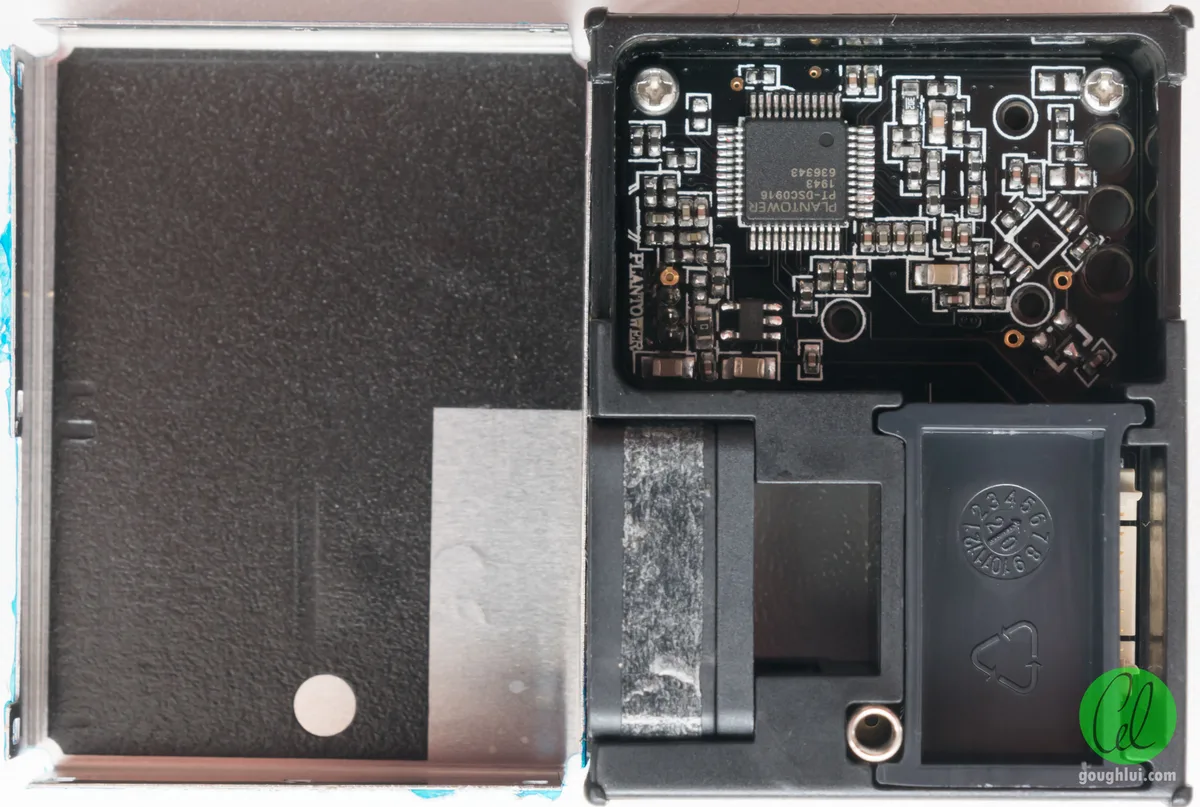
The biggest problem is water. On a humid morning, particles soak up moisture and swell, the laser sees bigger particles, and the sensor reports more mass than is really there. The US EPA studied about 12,000 days of these sensors sitting next to reference monitors across 16 states and found the raw readings ran around 40% high (Barkjohn et al., 2021). They came up with a correction that uses the sensor's own humidity reading, later extended for very smoky air. Above about 340 µg/m³, the correction actually pushes the number UP, because at those levels the sensor starts undercounting instead.
That process of comparing a cheap sensor against a reference and fitting a formula is what calibration means. It isn't optional, and it's also only as good as the reference it was fitted against. The EPA's formula was fitted on American air, which has different particles from a Jammu winter full of dust and wood smoke. Researchers working in Indian cities keep running into the same thing, which is that these sensors do worse when the air is humid and full of smoke (pretty much a description of our winters), and when CSTEP tried two different humidity corrections on the same optical monitors, the results came out about 50% apart. CPCB, for its part, doesn't use low-cost sensors for anything official.
The other weak spot is big particles. Laser sensors are tuned for fine particles, and they're known to undercount coarse dust, so the PM10 numbers from sensors like ours are probably low, especially in a dusty city like Jammu. That's part of why this post mostly sticks to PM2.5.
I'll be honest about our own data here too. When we went through AirGradient's exports for our network this month, we found that its "corrected" PM2.5 didn't mean the same thing on every sensor. AirGradient lets each sensor pick its own correction. Some of ours had the EPA formula, and the rest had a correction made for their sensor batch, which only kicks in when the air is fairly clean (under about 31 µg/m³), so through most of the winter they were effectively reporting raw numbers. At Billawar, which has EPA, raw data puts 7 of 9 days over India's daily limit, and the corrected numbers put 1. So two sensors breathing the same air could come out quite differently depending on a setting.
Since 14 November, our API puts every sensor on the EPA formula. It works out, day by day, whether AirGradient was already applying EPA to a sensor. If it was, we keep AirGradient's numbers, and if it wasn't, we work EPA out ourselves from the sensor's raw reading and humidity. Our stored history has been through the same thing, and every chart and number in this post uses the corrected data. Compared to the old numbers, an ordinary Jammu day came out a little lower, and the very worst Diwali minutes came out higher, because above about 340 µg/m³ the formula goes up. The one gap is Leh, Samba and Kargil, whose sensors we read from AirGradient's public feed. Raw readings from those only go back to 12 November, so their Diwali numbers are still AirGradient's own.
What low-cost sensors ARE very good at is when and where. Two sensors from different companies in Gandhi Nagar rose and fell together almost perfectly (a correlation of 0.96, where 1 is perfect lockstep), and at Kanipora it was 0.995 for daily averages. They argue about how much, and they almost never argue about which hour was the worst one.
That "correlation" number comes up a lot in arguments about sensors, so here's what it actually means. It only asks one question, which is whether two things go up and down at the same time. It doesn't care about the level at all.
| 1 pm | 2 pm | 3 pm | 4 pm | 5 pm | |
|---|---|---|---|---|---|
| Sensor A | 40 | 80 | 120 | 80 | 40 |
| Sensor B | 20 | 40 | 60 | 40 | 20 |
These two rise and fall at exactly the same moments, so their correlation is a perfect 1. But B reads half of A every single time. So to compare two sensors you need two numbers. The correlation tells you whether they see the same events, and the ratio (B divided by A, here 0.5) tells you how far apart their levels are.
That's why the AQI.in comparisons above have both a correlation and a percentage. The sensors saw the same events (high correlation), and disagreed on how big those events were (the percentages). It's also why a model with a correlation of 0.32 against our Jammu sensors, which we'll get to next, is a bigger problem than a sensor that reads 20% high. A sensor that reads 20% high still tells you when to close the windows.
Why every app shows a different number
The models
Google Maps and Apple Weather don't have a sensor near you. Google's Air Quality service works on a grid of 500 by 500 metre squares across 100 countries (Google's docs), and in India it's a model fed by government stations, satellites, weather and traffic (Google's India blog). Apple gets its air quality for India from BreezoMeter, which Google bought in 2022, so it's a model too. Neither publishes how accurate it is here. When Google's version launched, The Telegraph found it showing 297 for central Kolkata while the official figure was 160 to 175.
I can't download Google's or Apple's numbers to check them against ours, but I can do the next best thing. Most of these services lean on (or are built a lot like) the big global air quality forecasts, and the one that's free to download is CAMS, the European Copernicus forecast, which Open-Meteo serves for any point on the map. So I pulled it for Jammu, Srinagar and Leh for every hour from 1 October to 12 November and put it next to our sensors.
Show the numbers
| Jammu, Our sensors | Jammu, Model (CAMS) | Srinagar, Our sensors | Srinagar, Model (CAMS) | Leh, Our sensors | Leh, Model (CAMS) | |
|---|---|---|---|---|---|---|
| 1 Oct 2026 | 54.6 | 38.2 | 50.4 | 28.4 | ||
| 2 Oct 2026 | 61.4 | 48.5 | 46.3 | 35.3 | 2.9 | 5.6 |
| 3 Oct 2026 | 68.6 | 54.4 | 47.7 | 34.9 | 5.9 | 6.3 |
| 4 Oct 2026 | 83.3 | 58.7 | 57.7 | 32.6 | 6.5 | 4.8 |
| 5 Oct 2026 | 96.5 | 79.4 | 60.6 | 36.2 | 7.1 | 4.1 |
| 6 Oct 2026 | 75.9 | 67.9 | 76.8 | 30.6 | 3.6 | 3.7 |
| 7 Oct 2026 | 53.3 | 47.2 | 57.2 | 34.4 | 1.5 | 5.1 |
| 8 Oct 2026 | 56.9 | 47.4 | 34.5 | 42.6 | 3.5 | 5.8 |
| 9 Oct 2026 | 50.5 | 43.8 | 37.2 | 35.6 | ||
| 10 Oct 2026 | 72.7 | 58.2 | 52.2 | 29.9 | 1.9 | 5.9 |
| 11 Oct 2026 | 55.7 | 34.6 | 61.1 | 29.7 | 7.6 | 5.4 |
| 12 Oct 2026 | 46.3 | 41.6 | 70.4 | 36.1 | 4.4 | 5.8 |
| 13 Oct 2026 | 50.6 | 26.5 | 58.1 | 25.0 | 11.0 | 5.7 |
| 14 Oct 2026 | 51.6 | 24.3 | 13.4 | 18.9 | 4.7 | 4.9 |
| 15 Oct 2026 | 29.3 | 21.4 | 13.5 | 14.7 | 2.7 | 4.0 |
| 16 Oct 2026 | 39.8 | 26.8 | 40.0 | 30.5 | 5.5 | 4.3 |
| 17 Oct 2026 | 53.6 | 32.9 | 51.1 | 34.0 | 4.3 | 8.3 |
| 18 Oct 2026 | 50.8 | 27.1 | 50.4 | 29.9 | 7.2 | 8.2 |
| 19 Oct 2026 | 60.2 | 21.7 | 64.8 | 31.0 | 4.6 | 7.2 |
| 20 Oct 2026 | 67.9 | 29.7 | 72.7 | 37.1 | 2.9 | 10.2 |
| 21 Oct 2026 | 73.3 | 30.0 | 76.3 | 30.3 | 10.2 | 9.3 |
| 22 Oct 2026 | 84.7 | 36.4 | 78.1 | 41.4 | 13.1 | 8.5 |
| 23 Oct 2026 | 101.1 | 39.2 | 73.9 | 42.2 | 4.8 | 7.5 |
| 24 Oct 2026 | 48.1 | 31.3 | 59.6 | 39.8 | 10.1 | 7.3 |
| 25 Oct 2026 | 56.9 | 32.8 | 66.4 | 40.2 | 11.9 | 10.3 |
| 26 Oct 2026 | 71.2 | 31.4 | 71.8 | 38.9 | 12.5 | 10.7 |
| 27 Oct 2026 | 75.2 | 30.6 | 76.7 | 39.3 | 12.7 | 7.5 |
| 28 Oct 2026 | 62.4 | 27.2 | 80.5 | 38.4 | 12.2 | 7.4 |
| 29 Oct 2026 | 65.1 | 27.2 | 80.2 | 38.6 | 12.5 | 9.5 |
| 30 Oct 2026 | 112.7 | 47.2 | 72.7 | 30.8 | 17.2 | 7.2 |
| 31 Oct 2026 | 163.2 | 54.6 | 74.5 | 45.1 | 11.6 | 7.4 |
| 1 Nov 2026 | 156.5 | 52.9 | 92.9 | 49.7 | 18.7 | 5.0 |
| 2 Nov 2026 | 145.6 | 36.1 | 72.5 | 36.9 | 12.9 | 4.0 |
| 3 Nov 2026 | 113.8 | 33.6 | 59.6 | 43.4 | 12.6 | 5.8 |
| 4 Nov 2026 | 111.6 | 35.7 | 80.4 | 44.2 | 13.4 | 6.4 |
| 5 Nov 2026 | 101.9 | 36.8 | 93.4 | 44.7 | 9.3 | 8.0 |
| 6 Nov 2026 | 99.6 | 31.3 | 82.4 | 53.6 | 13.1 | 6.4 |
| 7 Nov 2026 | 116.9 | 38.5 | 96.2 | 48.2 | 17.0 | 6.1 |
| 8 Nov 2026 | 189.7 | 39.6 | 112.0 | 45.3 | 23.3 | 4.9 |
| 9 Nov 2026 | 145.3 | 40.3 | 136.1 | 55.0 | 19.5 | 7.3 |
| 10 Nov 2026 | 117.4 | 45.4 | 143.4 | 54.7 | 14.4 | 7.4 |
| 11 Nov 2026 | 122.3 | 42.1 | 86.1 | 52.0 | 18.9 | 6.2 |
| 12 Nov 2026 | 101.4 | 47.2 | 56.6 | 46.1 | 13.8 | 6.2 |
In Jammu, the model averaged 40 µg/m³ over those six weeks. Our sensors averaged 84. On Diwali night, the model's worst hour in Jammu was 58 µg/m³, and ours was 680. The model's worst day in all six weeks was 5 October, which wasn't even in our top ten, and its daily numbers barely move together with ours (a correlation of 0.32). In Srinagar it did better on the shape of things (0.76), rising and falling roughly when our sensors did, but it still came in at about half the level, 38 against 68. In Leh, the model's Diwali peak was 8. Ours was 123.
That isn't because the people who build CAMS don't know what they're doing. A global model works with emissions inventories (estimates of how much each place burns, built years in advance), weather, and satellite pictures of haze from above, and a grid square tens of kilometres wide. It has no way of knowing that a few thousand houses in one city are bursting crackers on one particular night, or that a whole valley switched on its bukharis this week. And in Jammu, where there isn't a single live government monitor for a model to learn from, there's nothing on the ground to pull it back towards reality.
You can see the grid problem in Srinagar too. The model gave Kanipora and central Srinagar exactly the same number for every one of the 1,056 hours I pulled, because they sit inside the same grid square. Our sensors at those two spots disagree with each other all the time.
People often say weather apps "use satellite data", and that's close enough for a reply on X, but it's more accurate to say they use a model that leans on satellites. Either way, 1290 against 166 for the same city is what you get when one of them is a model, with whatever scale Apple uses past 500, and the other is a sensor on the ground.
The weather app on your phone
The weather app that came with your phone (Xiaomi, Oppo, Realme, OnePlus, whatever) is in the same boat, except it usually doesn't even tell you clearly where the number comes from. If an app can't tell you which sensor or which station it's reading, treat its AQI like a weather forecast, a decent hint about the general direction of things and not something to argue with people about. Some of our own zones (Anantnag, Baramulla, Katra and a few others) don't have a sensor yet and show modelled numbers from Open-Meteo, so, to be fair, this applies to us too.
The ground sensor networks
Ground sensor networks aren't automatically right either, and I say this as someone who runs one. We compared AQI.in's sensor in Gandhi Nagar against our AirGradient in the same neighbourhood for six months. It had 49 readings that can't physically happen, up to 9,862 µg/m³ of PM2.5 and a "US AQI" of 22,693. It also read 17 to 27% lower than ours whenever the air got above 100 µg/m³. Then at Kanipora, the same company's sensor read about 35% higher than ours, went offline for 49 days, and from July onwards its PM10 regularly came out lower than its PM2.5, which is impossible (PM10 includes all of PM2.5). One network, under in one place and over in another.
Diwali night itself showed the same thing. Averaged over the night, AQI.in's Gandhi Nagar sensor said 210 µg/m³ while ours said 285. At Kanipora, it said 230 while ours said 158. Same company, same night, opposite directions. If you'd been arguing about Diwali using only one of those sensors, you'd have been "right" in either direction depending on which part of town you lived in.
The rankings
And then there were the rankings. A post that did the rounds on 11 November listed the "Top 10 states with the highest and lowest AQI", with Mizoram at 1, Ladakh at 71 and J&K at 75. A state doesn't have an AQI. Averaging Jammu (122 µg/m³ that day by our sensors) with clean hill sensors gives you a number nobody in either place is breathing, and a state-wide AQI of 1 is a dead or empty station, not clean air. City rankings have the same problem in a smaller way, which brings us to the official numbers.
What the government actually publishes here
This is the part people in J&K argued about most, so let's look at what exists.
CPCB's live network has four stations in all of J&K and Ladakh as of this week (I pulled their live feed on 13 November). Srinagar has two, at Rajbagh and Khunmoh. There's one at Khrew in Pampore, and one at Skara Yokma in Leh. Jammu, with 8.8 lakh vehicles registered there (Down To Earth), has none. It doesn't appear in CPCB's daily AQI bulletin at all.
What Jammu has is manual stations. News reports usually mention five of them (Narwal, MAM Stadium, Bikram Chowk, Dogra Hall and Janipur), but the J&K Pollution Control Board's own site lists ten in Jammu district, nine of which have data for this year. Under CPCB's rules, manual stations take a 24-hour sample twice a week, 104 days a year. Somebody runs a pump through a filter for a day, takes the filter to a lab and weighs it. So a "monthly average" for Jammu is built from about eight days, and whether Diwali night is one of them depends on the calendar. The board publishes these only as monthly figures, inside a chart on a page that's honestly painful to get data out of (thanks to FlashWreck for writing a scraper for it, which is how every JKPCB number in this post was collected). Here is Narwal, the busiest of them, against our four Jammu sensors, month by month.
I expected the official numbers to just be lower, and in winter they are, about half of ours in January and February. But from April to June, Narwal is higher than our sensors. The official line is flatter. It sees less of the winter spike and more of the summer dust (which makes sense, since our laser sensors undercount coarse dust, and one fixed station in Narwal isn't four sensors spread across the city). So "the government sensors always undervalue" isn't quite right either. They measure something different, much less often, in fewer places, and November's figure was already published on the 13th as if the month was over.
Averaged across all nine stations, January to October, the official PM2.5 for Jammu comes out at 42.5 µg/m³. Our four sensors, over the same months, average 59.6. That's the honest version of "the government numbers are lower". Lower, yes, by a bit under a third, mostly in winter, and not uniformly.
Where the official network is genuinely useful is PM10, the coarse dust that our laser sensors are bad at. Every one of those nine stations was above India's annual PM10 limit (60 µg/m³) in at least 8 of the 10 months this year, and five of them (Narwal, Bikram Chowk, Janipur, Dogra Hall and Bantalab) were above it every single month. The nine stations together average 92 µg/m³ of PM10, and Bikram Chowk averages 120. If you live in Jammu, that's the dust you can see on every windowsill, and it's there in July as much as in January. On this one, I'd trust their filters over our lasers.
The data has its own problems, though. Three of the monthly PM2.5 figures for this year are published as exactly 0 µg/m³ (Nagbani and Sidhra in January, Belicharana in September), which isn't clean air, it's a missing month written down as a zero. Anyone who averages that column without looking will drag Jammu's numbers down. And in January, the dirtiest month of the year, Dogra Hall reported 133 µg/m³ of PM10 but only 22 of PM2.5, and Janipur 124 and 20. In the middle of a smoky Jammu winter, PM2.5 being a sixth of PM10 is very hard to believe, when the same stations report it at around half in the other months.
How a city gets one number
Before the Srinagar numbers, it's worth knowing how CPCB's bulletin turns stations into a city. Each station works out a sub-index for every pollutant it measures, using the last 24 hours (8 for carbon monoxide and ozone). It needs at least 16 hours of data for a sub-index to count, and at least three pollutants, one of which has to be PM2.5 or PM10. The station's AQI is the worst of its sub-indices, and that pollutant gets named as the "prominent" one. Then, for a city with more than one station, the bulletin averages the stations that qualified that day.
CPCB is surprisingly honest about that last step. The notes at the bottom of every bulletin say that "air quality may show variations across locations, and averaging is not a scientifically sound approach. However, for the sake of simplicity this method is being followed." Each city in the bulletin also shows how many of its stations made it in that day, as "1/2" or "2/2", which almost nobody screenshots.
And sometimes a station doesn't make it at all. Pampore's station at Khrew was missing from three of the five bulletins between 8 and 12 November, listed under "Cities absent in AQI Bulletin due to insufficient data". On 13 November, CPCB's live feed showed Khrew's PM2.5 for the last 24 hours ranging up to 389, with no AQI worked out for it at all. On the nights people most want an official number, the stations are most likely to have gaps.
Srinagar's "Good" week
Srinagar is where it gets hard to defend. Here are CPCB's daily bulletins for Srinagar this week, against our five Srinagar sensors put through CPCB's own formula over the same 24 hours.
On 10 November, the bulletin gave Srinagar a 40, "Good", worked out from one of its two stations. The next day, the J&K pollution control body told Greater Kashmir that the readings circulating online "are not reliable" and that its stations showed "good" air in Srinagar. Our five sensors averaged 331 on the Indian scale, "Very poor", and the cleanest of them (Hazratbal) was 236, "Poor". On 12 November, the bulletin's 19 (the number in that "least polluted cities" post) came from one station, and the pollutant driving it was NO2, which means PM2.5 at that station was either very low or not counted. Our sensors averaged 168.
Before anyone says "those are just cheap sensors", take 40% off every one of our readings for the humidity problem from earlier. 10 November still comes out "Poor". Five sensors across the city, Hazratbal to Kanipora, don't all fail in the same direction by that much.
I don't think Rajbagh is broken. It's one station in one spot, and it may well have been measuring cleaner air in its corner of the city. The problem is a single station's number going out as "Srinagar", then going viral as "the cleanest city in India", while the people living in Bemina and Kanipora are breathing something else entirely.
For a sense of scale, Kanipora (the one sensor we've had in Srinagar for over a year) averaged 109 µg/m³ from 1 to 12 November this year. The same twelve days last year averaged 188. So this "Good" week was, at Kanipora at least, a much better week than the same week last year, and still about seven times the WHO's daily guideline. Last November went on to average 294 there, and December 364, as I wrote last time. Whatever the bulletin says this winter, it would be worth remembering this week.
One city, one number?
How different can two parts of the same city be? Here are the cleanest and the dirtiest of our five Srinagar sensors, every day for the first twelve days of November, with the single number the model gives the whole city.
Show the numbers
| Dirtiest sensor | Cleanest sensor | Model, whole city | |
|---|---|---|---|
| 1 Nov 2026 | 113.8 | 63.8 | 49.7 |
| 2 Nov 2026 | 86.1 | 51.5 | 36.9 |
| 3 Nov 2026 | 82.4 | 36.8 | 43.4 |
| 4 Nov 2026 | 109.1 | 55.8 | 44.2 |
| 5 Nov 2026 | 109.3 | 70.5 | 44.7 |
| 6 Nov 2026 | 104.5 | 56.3 | 53.6 |
| 7 Nov 2026 | 113.2 | 67.3 | 48.2 |
| 8 Nov 2026 | 132.5 | 78.2 | 45.3 |
| 9 Nov 2026 | 169.4 | 88.9 | 55.0 |
| 10 Nov 2026 | 179.4 | 87.0 | 54.7 |
| 11 Nov 2026 | 108.5 | 48.8 | 52.0 |
| 12 Nov 2026 | 77.6 | 31.3 | 46.1 |
On every one of those days, Srinagar's dirtiest sensor read somewhere between 1.6 and 2.5 times its cleanest. That's not noise, because it shows up day after day in the same direction. I don't know exactly why each spot is the way it is (my guess is that Hazratbal, up by the lake with more open space, gets more wind, while Brein Nishat and Kanipora have more houses around them burning things to stay warm), but the difference is real. Jammu's four sensors are closer together in level (the dirtiest read 1.3 to 2.0 times the cleanest over the Diwali week), probably because the plains mix more evenly than a valley does, but even there, "the AQI in Jammu" is an average over places that are breathing quite different air. And the model, as a single dashed line, sits below even our cleanest Srinagar sensor on 9 of those 12 days.
Where they agree
To be fair to CPCB, here's a case that goes the other way. Leh's official station at Skara Yokma is about 2 km from our sensor at Zero Waste Ladakh. Over the 24 hours to 9 pm on 13 November, CPCB's feed gave the station a PM2.5 figure of 13, with a maximum of 27. Our sensor averaged 9, with a maximum of 37. That's a reference instrument and a laser sensor agreeing pretty well, in a small town on a clean day with a lot of wind. When the air is clean and even, everybody's number comes out close. It's on the bad nights, in crowded cities, in valleys, with one station per city, that the numbers come apart, which is exactly when people go looking for them.
Diwali, by the numbers
Two quick things before the numbers, because a few people asked after reading the first version of this.
First, which pollutant is the AQI actually about? Whichever one is worst at the time, since the index is the highest of its sub-indices. For the official stations here, that mostly turns out to be PM10, the coarser dust. CPCB's bulletin named PM10 as Srinagar's main pollutant on four of the five days around Diwali, and across Jammu's ten manual stations this year, PM10 works out to an Indian AQI of about 92 against about 71 for PM2.5. Our sensors almost always land on PM2.5 instead. PM10 decided our Jammu AQI in only 663 of the 7,038 hours we recorded this year, about half of them in the dusty months of April to June, and on Diwali night it was PM2.5 every single hour. Part of that is real (smoke is mostly fine particles), and part of it is our laser sensors undercounting coarse dust. Either way, it's one more reason an official AQI and ours can disagree for the same air - quite often they aren't even about the same pollutant.
Second, why this post is almost all PM2.5. PM10 is mostly dust and a lot of it stops in your nose and upper airways. PM2.5 gets into the deepest part of your lungs and into your blood, and it's the one tied most strongly to the long-term harm, the heart and lung disease and the years of life lost (WHO, 2021). Crackers, heating, cooking fires and exhaust all put out mostly PM2.5. Over a year, it's PM2.5 that does most of the damage, so that's the one we watch hardest. PM10 still shows up below, wherever it changes the picture.
Here's Diwali night at our four Jammu sensors, every 15 minutes.
Show the numbers
| Talab Tillo | Gandhi Nagar | Channi Himmat | Suchetgarh, RS Pura | |
|---|---|---|---|---|
| 8 Nov, 3:00 pm | 64.0 | 68.0 | 63.7 | 63.5 |
| 8 Nov, 3:15 pm | 61.0 | 69.8 | 57.3 | 65.8 |
| 8 Nov, 3:30 pm | 69.7 | 69.3 | 51.7 | 66.8 |
| 8 Nov, 3:45 pm | 69.7 | 77.5 | 58.0 | 64.7 |
| 8 Nov, 4:00 pm | 62.5 | 106.8 | 54.5 | 71.5 |
| 8 Nov, 4:15 pm | 64.3 | 98.5 | 98.5 | 75.2 |
| 8 Nov, 4:30 pm | 73.3 | 90.0 | 71.5 | 72.5 |
| 8 Nov, 4:45 pm | 77.5 | 101.7 | 73.0 | 99.5 |
| 8 Nov, 5:00 pm | 94.5 | 105.3 | 73.5 | 83.2 |
| 8 Nov, 5:15 pm | 85.0 | 86.8 | 86.0 | 114.0 |
| 8 Nov, 5:30 pm | 164.8 | 148.7 | 96.2 | 94.3 |
| 8 Nov, 5:45 pm | 185.3 | 156.8 | 116.7 | 154.0 |
| 8 Nov, 6:00 pm | 219.0 | 179.7 | 194.2 | 118.7 |
| 8 Nov, 6:15 pm | 221.3 | 236.3 | 164.2 | 130.3 |
| 8 Nov, 6:30 pm | 207.0 | 189.2 | 159.7 | 229.2 |
| 8 Nov, 6:45 pm | 224.2 | 204.0 | 190.0 | 244.0 |
| 8 Nov, 7:00 pm | 256.0 | 224.5 | 188.3 | 324.0 |
| 8 Nov, 7:15 pm | 264.0 | 212.3 | 231.8 | 314.8 |
| 8 Nov, 7:30 pm | 299.3 | 257.1 | 483.5 | 269.2 |
| 8 Nov, 7:45 pm | 395.2 | 298.5 | 368.7 | 339.3 |
| 8 Nov, 8:00 pm | 403.5 | 422.1 | 444.5 | 538.3 |
| 8 Nov, 8:15 pm | 514.8 | 386.6 | 486.8 | 947.9 |
| 8 Nov, 8:30 pm | 512.7 | 861.0 | 737.3 | 945.5 |
| 8 Nov, 8:45 pm | 563.3 | 650.9 | 658.4 | 693.5 |
| 8 Nov, 9:00 pm | 647.4 | 368.1 | 905.5 | 840.7 |
| 8 Nov, 9:15 pm | 681.8 | 541.5 | 811.9 | 827.5 |
| 8 Nov, 9:30 pm | 563.7 | 524.2 | 602.0 | 968.3 |
| 8 Nov, 9:45 pm | 655.0 | 430.7 | 694.2 | 930.7 |
| 8 Nov, 10:00 pm | 561.7 | 379.8 | 698.8 | 699.2 |
| 8 Nov, 10:15 pm | 673.8 | 339.5 | 720.2 | 739.5 |
| 8 Nov, 10:30 pm | 569.2 | 679.3 | 648.3 | 723.7 |
| 8 Nov, 10:45 pm | 1011.5 | 405.0 | 706.2 | 770.0 |
| 8 Nov, 11:00 pm | 756.6 | 344.7 | 696.2 | 729.6 |
| 8 Nov, 11:15 pm | 391.5 | 279.0 | 694.6 | 989.3 |
| 8 Nov, 11:30 pm | 315.9 | 283.8 | 670.0 | 1036.7 |
| 8 Nov, 11:45 pm | 185.2 | 341.4 | 674.3 | 875.1 |
| 9 Nov, 12:00 am | 213.9 | 524.5 | 516.5 | |
| 9 Nov, 12:15 am | 120.2 | 190.8 | 365.7 | 612.5 |
| 9 Nov, 12:30 am | 255.3 | 208.4 | 620.7 | |
| 9 Nov, 12:45 am | 140.3 | 210.7 | 183.6 | 612.0 |
| 9 Nov, 1:00 am | 121.7 | 244.7 | 203.6 | 610.3 |
| 9 Nov, 1:15 am | 109.3 | 157.0 | 590.3 | |
| 9 Nov, 1:30 am | 122.3 | 135.2 | 195.0 | 563.1 |
| 9 Nov, 1:45 am | 123.7 | 128.7 | 184.7 | 577.7 |
| 9 Nov, 2:00 am | 97.8 | 122.8 | 324.5 | 537.5 |
| 9 Nov, 2:15 am | 94.0 | 116.0 | 357.7 | 438.8 |
| 9 Nov, 2:30 am | 132.2 | 111.8 | 333.2 | 326.0 |
| 9 Nov, 2:45 am | 99.7 | 109.8 | 228.5 | 294.2 |
| 9 Nov, 3:00 am | 84.3 | 106.7 | 121.5 | |
| 9 Nov, 3:15 am | 90.5 | 112.3 | 174.2 | |
| 9 Nov, 3:30 am | 107.8 | 182.1 | 148.6 | |
| 9 Nov, 3:45 am | 87.9 | 86.7 | 126.4 | |
| 9 Nov, 4:00 am | 109.9 | 86.4 | 68.0 | 102.2 |
| 9 Nov, 4:15 am | 65.9 | 83.6 | 85.6 | 91.9 |
| 9 Nov, 4:30 am | 78.5 | 109.5 | 184.3 | 115.0 |
| 9 Nov, 4:45 am | 76.8 | 111.2 | 150.0 | 115.3 |
| 9 Nov, 5:00 am | 72.3 | 112.2 | 112.5 | 112.7 |
| 9 Nov, 5:15 am | 75.3 | 110.0 | 107.5 | 112.0 |
| 9 Nov, 5:30 am | 86.7 | 105.2 | 100.8 | 112.7 |
| 9 Nov, 5:45 am | 127.7 | 105.3 | 86.8 | 109.3 |
| 9 Nov, 6:00 am | 117.2 | 99.7 | 86.7 | 108.0 |
| 9 Nov, 6:15 am | 73.2 | 94.5 | 68.5 | 106.2 |
| 9 Nov, 6:30 am | 73.0 | 89.7 | 68.9 | 86.0 |
| 9 Nov, 6:45 am | 67.6 | 74.9 | 69.6 | 82.2 |
| 9 Nov, 7:00 am | 71.0 | 74.0 | 87.4 | 85.3 |
| 9 Nov, 7:15 am | 55.4 | 68.1 | 494.6 | 82.3 |
| 9 Nov, 7:30 am | 58.4 | 67.9 | 176.8 | 93.1 |
| 9 Nov, 7:45 am | 55.8 | 70.8 | 73.2 | 103.7 |
| 9 Nov, 8:00 am | 50.2 | 76.2 | 86.8 | 89.6 |
| 9 Nov, 8:15 am | 51.8 | 80.4 | 92.0 | 85.8 |
| 9 Nov, 8:30 am | 56.9 | 81.6 | 78.1 | 81.3 |
| 9 Nov, 8:45 am | 56.7 | 101.2 | 115.1 | 97.7 |
| 9 Nov, 9:00 am | 59.6 | 102.5 | 151.5 | 115.8 |
All four started climbing after 6 pm, all four were between 404 and 538 µg/m³ by 8 pm, and between 524 and 968 by 9:30 pm. Talab Tillo and Suchetgarh both went past 1,000 later that night, 1,012 at 10:45 pm and 1,037 at 11:30 pm. Talab Tillo and Suchetgarh are about 24 km apart. In the city as a whole, the night (6 pm to 6 am) averaged 344 µg/m³, against 121 for the week before. Jammu went above twice its normal level at 7 pm and came back under it at 2 am, so about seven hours in all. Udhampur was a little longer, about eight. Samba, already one of the worst places we measure on an ordinary day, only spent about three hours above double, mostly because double of an already high number is a lot harder to reach.
It wasn't only Jammu, either.
Doda's sensor at Kashtigarh hit 915 µg/m³, which is right up against the 1000 µg/m³ limit where CPCB's analysers would have started throwing readings away. Reasi went from 46 to 545. Udhampur and Samba, which already sit above 100 µg/m³ on an ordinary November week, peaked at 500 and 376.
Kashmir looked different. Srinagar barely moved on Diwali night itself (its worst days came after, on the 9th and 10th, which is the heating season starting, not crackers). Kanipora, which is the one sensor we've had in Srinagar long enough to compare two Diwalis, averaged 133 µg/m³ through Diwali night in 2025 and 167 in 2026, against 96 for the week before both times. That's a bump of 40 to 75%, against Jammu's night at two and a half times its normal week. Ganderbal peaked at 132 for fifteen minutes and was back down within the hour, and Bandipora barely noticed at all.
Leh is its own story. Its weekly average before Diwali was 16 µg/m³, and between 7 pm and 7:30 pm on Diwali it read 111, 163 and 125, three readings in a row. Then it dropped straight back down. A 45-minute burst in a small town in thin, windy air, ten times its normal level, and then gone. Kargil, at 50 µg/m³ for its worst 15 minutes, had the quietest Diwali of anywhere we measure.
The arguments I kept seeing
Most of the arguments this week, online and off, came down to a handful of claims, said a hundred slightly different ways. Our data can actually say something about each of them, and in almost every case, both sides had a piece of it.
"One sensor can be fooled by a cigarette"
This one is true. Hold a lit cigarette or a match next to a laser sensor and it'll read hundreds of µg/m³, because to the sensor, smoke is smoke. That's exactly why you don't trust a single sensor, and why the chart above has four. Four sensors across 24 km rising together, minute by minute, isn't somebody smoking next to one of them. It's the whole city.
"The wind took it away" against "wind can't do that much"
Nobody arguing about this seemed to have wind data, so I pulled it. The weather model for Jammu has Diwali night at about 7.6 km/h from the north-east (so yes, blowing towards Punjab and Pakistan), against 3 to 5 km/h on most other nights that week, with the night-time mixing layer (the "lid") only 20 to 35 metres deep. So it WAS windier than usual.
But the best explanation I saw all week was a water tank, and it's genuinely the right way to think about this. Think of the city as a tank. Pollution flows in from everyday sources, the wind drains it, and the level settles wherever the inflow and the drain balance out. Crackers are a burst of extra inflow for a few hours. Wind drains the burst and the everyday stuff at the same speed, so the burst clears within a few hours, and then the level settles right back where the everyday sources put it. That's why wind can take 700 down to 150 in a night but can't take an ordinary winter day in Jammu below 100. It drains, it doesn't stop the tap.
Play with it. Turn the crackers off and see what's left.
In the real data it looks like that, too. Gandhi Nagar peaked early, at 861 at 8:30 pm, and was down to 345 by 11 pm once people nearby stopped bursting crackers. Suchetgarh, out near the border, stayed above 500 until about 2 am. By 6 am, all four sensors were between 87 and 117, which is a normal November morning for Jammu.
"The air was fine until people started bursting crackers"
Here's every day of the last month. There are two bars for each day, and the gap between them is worth slowing down for, because it's the easiest thing in this whole post to misread.
The blue bar is the day's average, every hour from midnight to midnight added up and divided by 24. The orange bar is the single worst hour of that same day. On an ordinary day in Jammu, the worst hour is about twice the average, and it almost always lands between 7 and 8 in the evening. On Diwali, the average was 190 µg/m³ and the worst hour was 680. The worst 15 minutes at any one sensor were higher again, 1,037 at Suchetgarh, as you saw in the chart further up.
So which one is "the Diwali number"? Both, and that's exactly how a single number ends up misleading people. An average spreads a few terrible hours across a whole day. On 8 November, the crackers really only ran from about 6 pm to midnight, and the other 18 hours looked like any other bad November day. Those ordinary hours pull the average a long way down.
The six hours from 6 pm to midnight, with the crackers going, averaged 499 µg/m³. The other eighteen hours of the day averaged 87.
Add up all 24 hours and divide by 24.
Six awful hours and eighteen ordinary ones make a day of 190, even though no single hour of that evening was anywhere near 190.
The other side of it is that the average is also roughly what your body got over the day, which is why health limits (and CPCB's AQI) are written as 24-hour averages. Neither number is the fake one. The worst hour tells you how bad it got, and the average tells you how much you breathed. Whenever you see one PM2.5 or AQI number, it's worth asking which of the two it is. That goes for this post as well. Wherever I say a day "averaged" something, the worst hour of that day was usually about double.
The jump happened on 30 and 31 October, from 65 µg/m³ to 163 (as daily averages), more than a week before Diwali. No crackers were involved. By its average, Diwali day was the worst day of the year so far, at 190, but not by much. 1 February averaged 173, and 31 October 163. By its worst hour, it wasn't close. 680 is about twice the next worst hour of the month (334, just after midnight on that same night), and two and a half times anything outside Diwali (271, at 7 pm on 7 November).
I tried to work out what caused that jump, and I can only explain part of it. The wind dropped by about a third over those nights (from 6.7 km/h on the night of the 29th to 4.4 on the 30th and 3.3 by 1 November), which on its own would push the level up by roughly half, using the same tank maths. It went up by two and a half times. Late October is also when farm fires in Punjab ramp up (its pollution board had counted 717 by 27 October), and Jammu is right next door, but I can't prove from ground sensors alone how much of that smoke reached us. What I can say is that whatever it was, it started a week before Diwali and was still there a week after.
There's one more thing working against Jammu this autumn, and it's the weather. The last proper rain in Jammu was on 11 October (16 mm, according to the weather model), with a few millimetres on the 14th and 15th, and then nothing at all until a little on 13 November. Rain is the only thing that actually cleans the air rather than moving it around, since the drops collect particles on the way down, and it also damps down road dust. A month without it means the dust stays on the roads, gets kicked up by traffic, and the smoke from every evening just stacks on top of the last one.
"A ban won't fix even 1% of the problem"
This one you can check yourself. Below is every hour we've recorded in Jammu this year. Take Diwali night out (cap it at the week's normal level), or leave it in and cut everyday pollution by some amount, and compare what happens to the year.
Taking out Diwali night removes 0.68% of all the PM2.5 Jammu breathed this year, and the year's average goes from 57.0 µg/m³ to 56.6. Cutting everyday pollution by just 10% takes it to 51.3, takes 9 days off the 86 that were over India's limit, and takes the hours spent above 225 µg/m³ from 39 to 29. So for the year's total, "not even 1%" holds up.
Switch the widget to PM10 and it tells the same story. Taking out Diwali night moves the year's PM10 average from 73.9 µg/m³ to 73.5 (about half a percent of the total), while a 10% cut to everyday pollution takes it to 66.5 and takes 5 days off the 59 that were over India's PM10 limit. The one place Diwali does stand out is the very worst hours. Our Jammu sensors spent 6 hours this year above 424 µg/m³ of PM10, the EPA's "Hazardous", and 4 of them were on Diwali night.
It's worth slowing down on what "0.68% of the year" actually means, because it's the same trap as the daily averages earlier. Here is the sum, with the real numbers.
Add up the PM2.5 reading of every single hour we've recorded in Jammu this year. That's 7,038 hours, at an average of 57.0 µg/m³ each.
Now take Diwali night, 5 pm to 9 am, and for each hour work out how far it was above the normal level for that week, 121 µg/m³. From 6 pm onwards that's 78, 177, 487, 559, 525, 440, 213, 130 and 101, and nothing from 3 am.
Divide the extra by the whole year.
Diwali night added about two thirds of a percent to everything Jammu breathed this year. That's what "not even 1%" means.
But that's the total, the same way 190 was the daily average. Sort the year's hours from worst to best instead, and Diwali looks completely different.
The four worst hours of Jammu's entire year were all on Diwali night, 8 pm to midnight, between 561 and 680 µg/m³. Nothing else this year came close to 680. But look at what comes straight after them. The fifth worst hour of the year was 7 pm on 18 January, at 513, not far below Diwali's fourth, followed by 8 pm that same night at 490 and 7 pm the next day at 407. Of the 30 worst hours, only 7 were Diwali, and most of the rest are ordinary January and February evenings, with no crackers anywhere, when the city was just heating, cooking and driving under a winter inversion.
Srinagar makes the same point even more clearly, and it's worth spelling out, because every November someone there blames the bad air on Diwali crackers. Doing the same sums with our Srinagar sensors, Diwali night added about 0.29% of all the PM2.5 they recorded this year. Not one of Srinagar's 30 worst hours this year was on Diwali night. The worst hour that night was 148 µg/m³, while the worst hour of the year was 332, at 7 pm on 19 January, with no crackers anywhere. By daily average, 8 November was only Srinagar's fourth worst day. The two days after it (10 November at 143 and 9 November at 136) were worse, when the heating season started properly, and so was 19 January (138). And the air had been getting worse for months before Diwali came anywhere near it, from 15 µg/m³ on average in April to 33 in September, 59 in October and 87 so far in November. In Kashmir, the winter air comes from how people keep warm, which the heating section further down goes into.
Here's Srinagar's year sorted the same way as Jammu's above. Diwali night would show up in orange, and there's nothing orange on it.
And here's the same take-Diwali-out exercise, with Srinagar's own data. Try taking Diwali night out, then try cutting everyday pollution by even 5%, and compare what each does to the year.
Taking Diwali night out moves Srinagar's year from 34.8 µg/m³ to 34.7, and doesn't touch a single one of its 6 "Hazardous" hours or its 46 days over India's limit. Cutting everyday pollution by just 5% takes the year to 33.0, takes 3 days off those 46, and adds 8 days within the WHO's guideline.
So both of these are true, and they don't cancel out. Diwali night was the worst air of the year, hour for hour, and it was also about two thirds of a percent of the year's total. A cracker ban would take the top of the chart off. It wouldn't touch the 23 other hours on it, or the thousands of hours below them.
The flip side of that argument, that a few hours at 700 are worse than months at 200, gets the trade the wrong way round, because months at 200 is what we already have. Jammu was within the WHO's daily guideline on 2 of the 292 days we recorded, and over India's own, much looser, limit on 86 of them.
"Other countries burn fireworks too, and nobody complains"
They do, and somebody actually measured it. Researchers at NOAA looked at 315 monitoring stations across the US from 1999 to 2013 and found that the 24 hours starting at 8 pm on the Fourth of July averaged 42% more PM2.5 than the days around it (Seidel and Birnbaum, 2015). Next to one fireworks display, it was 370% more. And it was back to normal by noon the next day.
So yes, fireworks do the same thing everywhere. The difference is what they land on. In the US, the national average went up by about 5 µg/m³, which (if 5 is 42% of it) means it started from about 12. In Jammu, Diwali night went up by about 223 µg/m³, from a starting point that was already "Unhealthy". Same physics, very different baseline, which is pretty much the whole point of this post.
What those few hours do anyway
None of that makes Diwali night fine. Breathing 700 µg/m³ for a few hours is a real thing that happens to a real body. The people describing nausea, coughing and stinging eyes this week weren't being dramatic, and for anyone with asthma or a heart condition, a night like that can mean a hospital visit. The Lancet study from earlier found deaths rising with just two-day averages, and a few hours at 700 drags the two-day average up a lot. If you go back to the dose calculator, four hours outside on Diwali night is most of an ordinary day's PM2.5, squeezed into one evening, on top of the ordinary day you were already having.
What's in the smoke is different from everyday smoke, too. The colours in fireworks come from metals (strontium for red, barium for green, copper for blue), and that ends up in the air. In Amritsar on Diwali 2022, metals made up 22.7% of the PM2.5, with barium and strontium shooting up compared to normal days, and in Malda, arsenic and cadmium showed up in the very finest particles, the ones that get deepest into the lungs (Roy et al., 2025). CSIR-IITR in Lucknow found lead, cadmium and copper from fireworks staying in the soil and water afterwards.
That's the part people forget when the AQI drops. A lower number means the particles left the air above the sensor, and there are only two ways that happens. The wind carries them somewhere else (to Punjab, in our case, which is somebody else's air), or they settle onto roads, roofs, soil and water. The ones on the roads get kicked back up by every car that drives past. Nothing just disappears.
So both things are true at once, and I don't think that's a cop-out. Diwali is the worst few hours of the year and a rounding error in the year's total. You can be angry about the first without pretending it explains the second.
Why it keeps getting worse
The second one is the one that's actually hurting people slowly, so here's what's in it.
Start with what an ordinary day looks like. Here's Jammu, hour by hour, averaged over the seven weeks before Diwali, with Sundays split out.
Show the numbers
| Monday to Saturday | Sundays | |
|---|---|---|
| 12 am to 1 am | 70.0 | 68.0 |
| 1 am to 2 am | 65.0 | 64.0 |
| 2 am to 3 am | 61.0 | 60.0 |
| 3 am to 4 am | 56.0 | 57.0 |
| 4 am to 5 am | 55.0 | 61.0 |
| 5 am to 6 am | 57.0 | 71.0 |
| 6 am to 7 am | 68.0 | 81.0 |
| 7 am to 8 am | 75.0 | 84.0 |
| 8 am to 9 am | 75.0 | 83.0 |
| 9 am to 10 am | 70.0 | 79.0 |
| 10 am to 11 am | 68.0 | 69.0 |
| 11 am to 12 pm | 63.0 | 61.0 |
| 12 pm to 1 pm | 57.0 | 60.0 |
| 1 pm to 2 pm | 54.0 | 62.0 |
| 2 pm to 3 pm | 53.0 | 51.0 |
| 3 pm to 4 pm | 52.0 | 54.0 |
| 4 pm to 5 pm | 54.0 | 58.0 |
| 5 pm to 6 pm | 67.0 | 69.0 |
| 6 pm to 7 pm | 92.0 | 92.0 |
| 7 pm to 8 pm | 103.0 | 110.0 |
| 8 pm to 9 pm | 106.0 | 116.0 |
| 9 pm to 10 pm | 93.0 | 102.0 |
| 10 pm to 11 pm | 85.0 | 92.0 |
| 11 pm to 12 am | 74.0 | 80.0 |
The cleanest part of the day is mid-afternoon, around 52 µg/m³, when the sun has warmed the ground and the air is mixing upwards. There's a smaller bump in the morning (75 between 7 and 9 am), and then the big one, from 6 pm onwards, peaking at 106 between 8 and 9 pm. That evening peak is everything at once. Rush hour, cooking, rubbish fires, the first heaters, all poured into air that's cooling and getting trapped under the lid.
I expected Sundays to be cleaner, since there's less commuting. They weren't. Over the seven Sundays in that window, the average was 74 µg/m³, against 70 for the rest of the week, and Sunday evenings were the worst of all (116 between 8 and 9 pm). Seven Sundays isn't a lot, so I wouldn't hang anything on the exact numbers, but it does say that Jammu's evening air isn't only office traffic. Whatever people do at home in the evening (cooking, burning leaves and rubbish, going out, visiting family by car) is a big part of it.
Then there's the bigger picture. J&K has 26.6 lakh registered vehicles and adds about 20,000 every month, and 1.79 lakh were registered in 2025 alone (Down To Earth). In the same article, the emergency department at Srinagar's chest disease hospital went from 18,672 visits in 2017-18 to 32,133 in 2023-24.
In Kashmir, it's heating. The one proper study of Srinagar's winter air (Hakim et al., 2018) found domestic coal behind 84% of the PM2.5 emissions they counted, on top of firewood in hamams and bakeries and the charcoal in kangris. That's the rise you can see in our Srinagar numbers in the days after Diwali, while the bulletin was saying "Good". And in Jammu, there's the dust and construction, and in both places, the valley or the plain and the winter inversion trapping all of it near the ground, which I went through in the last post.
And then money. J&K was given Rs 223.7 crore under the National Clean Air Programme between 2019-20 and 2025-26 (Kashmir Life), and a 2024 review flagged both Jammu and Srinagar for using less than 75% of what they'd been given. Jammu, the winter capital, still doesn't have a single live government monitor.
None of these trend on Instagram, because none of them happen on one night. They happen every night.
Ladakh
Ladakh is the strangest case we have. Leh is the cleanest place in our network by far (3.3 µg/m³ on average in July, which is better than the WHO's annual guideline), and that's exactly what makes it fragile. On Diwali it jumped to ten times its weekly average for fifteen minutes, and in proportion, only Doda and Reasi jumped more. A place that clean has no "baseline" to hide a spike in.
The official station in Leh tells you almost nothing about any of this. Its daily AQI this week was driven by carbon monoxide and ozone, not particles, in every single bulletin. Ozone is a strange one, it isn't emitted by anything directly but forms when sunlight hits other pollutants, and at 3,500 metres the sunlight in Leh is very strong. So the one official number for Leh was mostly measuring something other than the smoke.
In winter, Leh heats itself with bukhari stoves burning wood, coal and dung (Reach Ladakh), and a year of sky measurements from Leh found the finest, most light-absorbing particles peaking in winter, which the authors linked to exactly that (IIA). Our Leh sensor has only been up since July, and its monthly average has already gone from 3.3 in July to 15 so far in November. We'll see what January looks like.
Further west, a study of 77 glaciers in the Drass basin found black carbon (soot) near the highway at levels higher than other high-altitude sites in the region, with heavy vehicles behind about 60% of it (The Hindu). Soot on snow and ice absorbs sunlight and speeds up melting, and that ice is the water supply. Air pollution in Ladakh is a lungs problem for a few months and a water problem for everyone downstream.
What this post can't tell you
I'd rather say these out loud than have someone find them for me.
Our sensors are low-cost laser sensors, and even after everything above, their absolute numbers could be off by tens of percent in either direction depending on humidity and what's in the smoke. I've tried to make every comparison one that survives that (the Srinagar one survives a 40% cut, the Diwali spike survives anything), but a reference-grade monitor next to one of ours for a full winter would settle a lot of this, and we don't have one.
The model I compared against is CAMS, not Google's or Apple's own system. They're built in a similar way and lean on the same kinds of inputs, but I can't download their numbers, so I can't show you theirs directly. The wind and rain numbers are from a weather model, not a weather station in Jammu. The tank is a toy, with one box, one wind speed and no lid, built to show the idea and not to predict anything. Seven Sundays isn't a lot of Sundays. And we don't have any indoor sensors, so I can't tell you what Diwali night was like inside anyone's house.
None of that changes the main point, which is that the screenshots people fought over this week were mostly answering different questions. It just means some of the exact numbers here deserve a "roughly" in front of them.
What you can actually do
Some of this is out of your hands, but not all of it.
Look at a sensor near you, not a model and not a city average. Our map has every sensor we run, and if there isn't one near you, the nearest one is still better than a grid square. Use the hour-by-hour chart above. In Jammu right now, early afternoon is the best time to be outside, and 6 to 10 pm is the worst, every day, Diwali or not. In Srinagar it's the morning until about 10:30 and then late at night, with the afternoon as the cleanest part of the day.
If you have to be out when it's bad, an N95 mask that actually seals against your face filters at least 95% of the smallest, hardest-to-catch particles (NIOSH). A loose cloth mask or a surgical mask with gaps at the sides does very little, because air goes around it instead of through it. Close the windows on the worst nights, and if you burn leaves to get rid of them, please don't, compost them.
And when you see an AQI screenshot, the next section is for you.
How to read the next AQI screenshot you see
Before you share one, or fight about one, ask:
- Which sensor or station is it, and how far away is it from the place it claims to describe?
- Is it a sensor at all, or a model?
- Is it one reading, or an average, and over how long?
- Which scale, and is it above 500? If it is, someone extended the scale, so compare the µg/m³ instead.
- Is it one station speaking for a whole city, or a whole state?
If a post can't answer most of these, it isn't wrong, exactly. It just isn't telling you very much.
In my opinion, the fix for most of what went wrong this month is boring. Publish the raw µg/m³ alongside the index, every hour, for every station, and put enough stations in a city that one corner can't speak for all of it. That's all we're doing with BreatheOSS. Every reading from every sensor is public through our API, and the data behind every chart in this post has a download link under it. If you think any of this is wrong, the numbers are right there, and I'd honestly like to hear about it on Discord.
And if you want to stop arguing about whose AQI is right in your neighbourhood, the easiest way is to put a sensor on your roof. We can help with that too.