The air was bad before anyone noticed
Why the air in Jammu and Srinagar gets worse every winter, what is actually in it, and what our ground sensors recorded between September and October 2026.
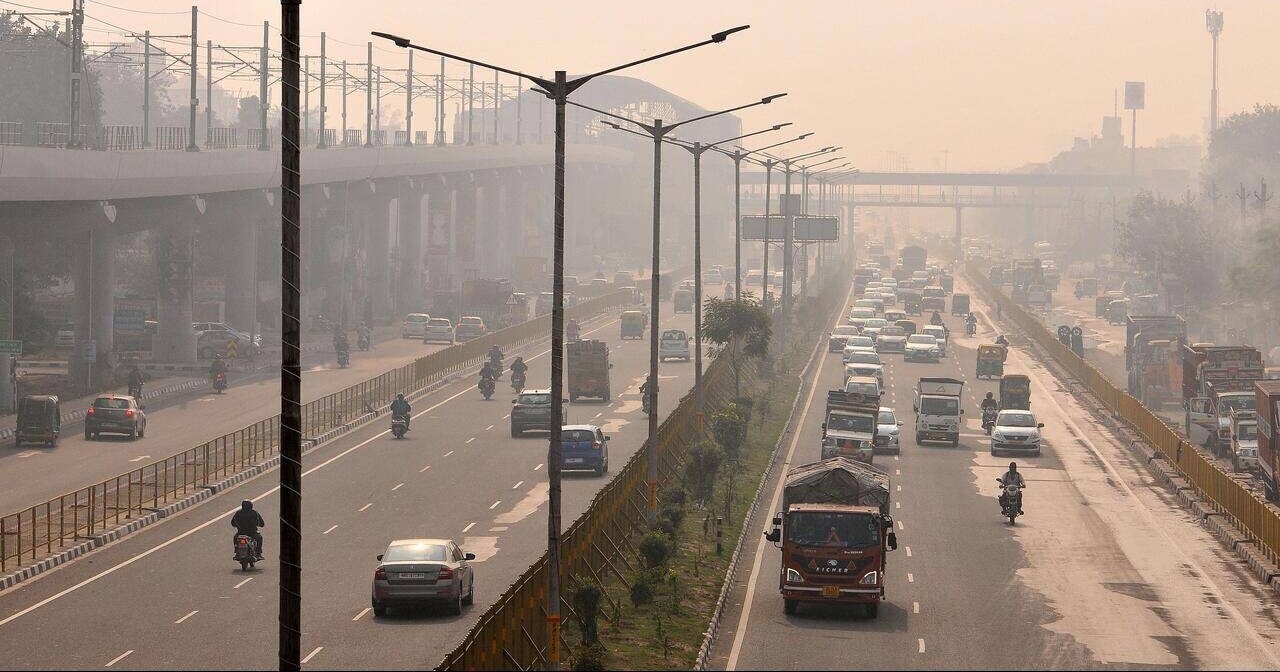
In recent years, somewhere around the end of October, people in Jammu & Kashmir (well, the north belt in general) start talking about the air. Someone posts the AQI in a group chat, it shows up on Twitter, Instagram reels start popping up (which is a good thing), and for a few weeks it's all anyone complains about. Then the weather turns, and by March nobody mentions it.
Our sensors were running well before the talk started this year, and between 10 September and 24 October, neither Jammu nor Srinagar had a single day the US EPA would call "Good".
What we're actually measuring
When people say "the AQI is bad", they almost always mean particles in the air. Two sizes matter. PM10 is anything smaller than 10 micrometres across - road dust, construction dust, pollen. PM2.5 is the finer stuff, under 2.5 micrometres, roughly thirty times thinner than a human hair. Most of it comes from burning things: fuel in engines, wood and coal for heating, leaves, rubbish.
PM2.5 is the one to worry about. Particles that small get past your nose and throat and settle deep in your lungs, and the smallest of them end up in your blood. That's why most of the numbers in this post are PM2.5.
The AQI is a way of turning those concentrations into a 0 to 500 scale with colours, so you don't have to know what 60 µg/m³ means. Different countries draw the lines in different places. India's daily limit for PM2.5 is 60 µg/m³; the US EPA's is 35, and the WHO recommends 15. So a day that India's scale calls "Moderate" can be "Unhealthy" on the EPA's, and the EPA's is the one we use here.
Why winter makes it worse
During the day, the sun heats the ground, and the ground heats the air just above it. Warm air rises, so whatever is in it (exhaust, smoke, dust) gets carried up and spread through a deep layer of the atmosphere. By the time you breathe it, it has been diluted a lot.
On a cold, clear night that stops working. The ground loses its heat quickly, the air touching it ends up colder than the air above, and cold air has no reason to rise. You get a layer of warmer air sitting on top of the cold layer like a lid on a pot. This is called a temperature inversion. Everything released under the lid stays in a thin layer near the ground until the sun is strong enough to break it up the next day, and in winter the sun is weaker and the nights are longer. A 2018 study of Srinagar's air puts it plainly: when temperatures are low, the boundary layer drops and "traps the pollutants close to the earth's surface".
Add less wind, less rain to wash particles out, and a lot more fires because people are cold, and you have winter.
You can see the lid in our own data. In Jammu, the average October reading bottoms out at about 50 µg/m³ in the middle of the afternoon. By 7:30 pm it's at 106. In September, the same evening climb only got to 77. Jammu's evening traffic probably didn't get 40% heavier in three weeks; most of that difference is the sun setting earlier and the air cooling faster, which packs the same exhaust and smoke into much less air.
Srinagar's average day has a different shape. Its worst hours come in the morning, between 8:30 and 10:30, when October readings averaged 70 µg/m³ (in September it was closer to 41), and again late in the evening. In between, as the valley warms up, it drops to about 34 by mid-afternoon.
Show the numbers
| Jammu, 10 to 30 Sep | Jammu, 1 to 24 Oct | Srinagar, 10 to 30 Sep | Srinagar, 1 to 24 Oct | |
|---|---|---|---|---|
| 12:30 am to 1:30 am | 57.9 | 59.9 | 38.8 | 61.1 |
| 1:30 am to 2:30 am | 58.5 | 55.8 | 37.4 | 58.3 |
| 2:30 am to 3:30 am | 57.7 | 52.2 | 37.2 | 55.9 |
| 3:30 am to 4:30 am | 54.5 | 51.6 | 36.8 | 53.7 |
| 4:30 am to 5:30 am | 52.8 | 55.0 | 37.8 | 54.0 |
| 5:30 am to 6:30 am | 57.5 | 59.3 | 37.7 | 54.3 |
| 6:30 am to 7:30 am | 67.7 | 69.3 | 40.4 | 55.5 |
| 7:30 am to 8:30 am | 64.4 | 73.7 | 42.8 | 62.8 |
| 8:30 am to 9:30 am | 58.5 | 71.9 | 40.9 | 69.6 |
| 9:30 am to 10:30 am | 60.6 | 66.2 | 40.7 | 70.1 |
| 10:30 am to 11:30 am | 57.5 | 66.1 | 39.7 | 63.4 |
| 11:30 am to 12:30 pm | 54.0 | 60.8 | 34.9 | 54.8 |
| 12:30 pm to 1:30 pm | 52.3 | 54.9 | 30.2 | 47.2 |
| 1:30 pm to 2:30 pm | 51.3 | 51.5 | 26.2 | 39.9 |
| 2:30 pm to 3:30 pm | 51.5 | 50.2 | 22.9 | 37.4 |
| 3:30 pm to 4:30 pm | 49.8 | 51.7 | 20.1 | 34.4 |
| 4:30 pm to 5:30 pm | 51.1 | 57.6 | 19.9 | 34.7 |
| 5:30 pm to 6:30 pm | 57.1 | 74.2 | 25.6 | 45.2 |
| 6:30 pm to 7:30 pm | 66.1 | 102.7 | 38.5 | 58.3 |
| 7:30 pm to 8:30 pm | 76.7 | 105.5 | 45.4 | 66.9 |
| 8:30 pm to 9:30 pm | 76.2 | 93.2 | 47.4 | 68.7 |
| 9:30 pm to 10:30 pm | 74.0 | 81.8 | 46.9 | 70.0 |
| 10:30 pm to 11:30 pm | 68.9 | 71.7 | 46.5 | 66.2 |
| 11:30 pm to 12:30 am | 63.8 | 64.0 | 43.2 | 62.4 |
Jammu
Anyone who lives in Jammu knows the dust. Roads get dug up and stay that way, there is construction on every other street, and a lot of the city's roads are dusty all year, summer included. The city's own clean-air action plan, the one filed with the Central Pollution Control Board, lists "road dust due to bad road conditions" as the second biggest cause of pollution after vehicles, and blames it on the "worst condition of roads especially without black-topping, absence of water spraying".
After that, the plan lists small industry, construction and demolition, and the burning of garbage and biomass, and it gives each one a share - 60 to 70% for vehicles, 10 to 15% for road dust, and so on. None of those shares were measured. The same document says that "so far no source apportionment study with respect to air pollution in the city has been conducted", and elsewhere that no agency "has made any separate emission inventory". The numbers are estimates.
Our sensors can't settle that argument either, but they do say something about it. Over these six weeks, PM2.5 made up 89% of the PM10 our Jammu sensors measured. Dust is mostly coarse, so if dust were the main thing in the air you would expect PM10 to be far higher than PM2.5. A share that high points at fine particles, the kind that come from burning. There's a catch - low-cost optical sensors like ours are known to undercount coarse particles, so our PM10 numbers are probably low. The dust is real and you can see it. The stuff that gets deepest into your lungs looks more like smoke and exhaust.
The official numbers have improved, a bit. According to data tabled in the Lok Sabha and reported by Kashmir Life, Jammu's average PM10 went from 157 µg/m³ in 2017-18 to 124. The national annual limit is 60. Jammu is still at about twice that.
Kashmir
Srinagar sits at around 1,585 metres on the floor of a valley, with mountains on every side. Cold air is heavy, so on winter nights it slides down the slopes and collects at the bottom, which is exactly where the city is. The inversion lid over the valley is usually lower and stronger than it is in the plains, and nothing anyone does will change the shape of the valley.
What goes under the lid is a different matter. Kashmir heats itself in winter by burning things. Hamams are rooms warmed by firewood burnt under the stone floor. Kangris are clay pots of hot charcoal carried under the pheran. Bukharis are stoves that burn wood or coal. The 2018 study measured Srinagar's air through a full year in 2013-14 and found PM2.5 peaking at 348 µg/m³ on 24 November. When the authors added up emissions from coal, firewood and vehicles, domestic coal made up 84% of the PM2.5.
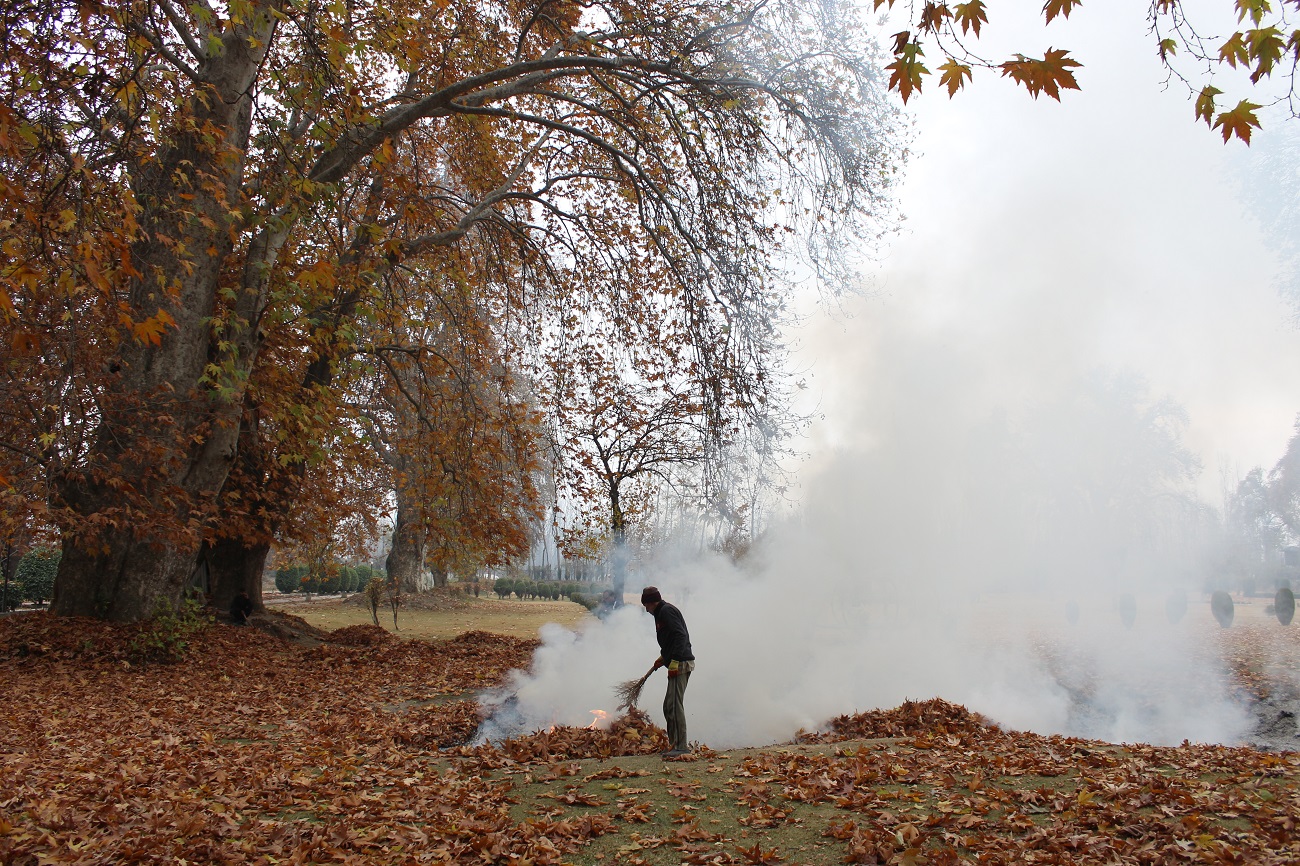
Then there are the leaves. Every autumn, fallen leaves (a lot of them chinar) get raked into piles and burnt, partly to make the charcoal that goes into kangris. The Srinagar Municipal Corporation banned burning leaves in November 2017. Six years later, its own sanitation officer was still fining people ₹10,000 for doing it, and this month the corporation was again asking for the leaves to be composted instead of burnt.
Srinagar's official action plan doesn't mention any of this. It puts vehicles at 65 to 75% of the city's pollution and biomass and garbage burning at 10 to 20%, and on the same page it says that "so far no source apportionment study has been conducted for this city". The only place wood and coal come up is a section on dhabas and restaurants. How people heat their homes through the winter isn't in it.
That is the part that can be fixed. The valley will always trap the air in winter. How much smoke goes into it is a choice, although not an easy one - people burn wood and coal because they need to stay warm, and they won't stop until there is something cheaper and more reliable to replace it with.
What our sensors recorded
Between 10 September and 24 October, our sensors in Jammu and Srinagar logged an hourly reading for every one of the 1,081 hours in that window. Here is what those readings look like, averaged by day.
Show the numbers
| Jammu | Srinagar | |
|---|---|---|
| 10 Sep 2026 | 51.6 | 38.1 |
| 11 Sep 2026 | 62.1 | 36.4 |
| 12 Sep 2026 | 62.6 | 21.0 |
| 13 Sep 2026 | 60.4 | 30.1 |
| 14 Sep 2026 | 54.7 | 32.5 |
| 15 Sep 2026 | 41.8 | 30.8 |
| 16 Sep 2026 | 50.8 | 41.7 |
| 17 Sep 2026 | 31.8 | 17.2 |
| 18 Sep 2026 | 44.9 | 26.4 |
| 19 Sep 2026 | 51.6 | 35.4 |
| 20 Sep 2026 | 54.1 | 48.0 |
| 21 Sep 2026 | 66.3 | 47.9 |
| 22 Sep 2026 | 88.1 | 38.3 |
| 23 Sep 2026 | 89.0 | 27.7 |
| 24 Sep 2026 | 69.3 | 26.4 |
| 25 Sep 2026 | 78.9 | 33.9 |
| 26 Sep 2026 | 70.7 | 47.2 |
| 27 Sep 2026 | 73.6 | 43.4 |
| 28 Sep 2026 | 55.5 | 42.0 |
| 29 Sep 2026 | 47.8 | 43.4 |
| 30 Sep 2026 | 54.8 | 60.1 |
| 1 Oct 2026 | 57.4 | 52.6 |
| 2 Oct 2026 | 64.6 | 50.1 |
| 3 Oct 2026 | 73.6 | 50.8 |
| 4 Oct 2026 | 86.7 | 59.0 |
| 5 Oct 2026 | 101.2 | 63.8 |
| 6 Oct 2026 | 80.6 | 79.4 |
| 7 Oct 2026 | 57.3 | 59.4 |
| 8 Oct 2026 | 59.2 | 35.0 |
| 9 Oct 2026 | 55.1 | 40.0 |
| 10 Oct 2026 | 76.9 | 54.3 |
| 11 Oct 2026 | 56.7 | 63.2 |
| 12 Oct 2026 | 51.5 | 73.0 |
| 13 Oct 2026 | 55.4 | 57.8 |
| 14 Oct 2026 | 58.5 | 15.0 |
| 15 Oct 2026 | 33.2 | 15.1 |
| 16 Oct 2026 | 46.1 | 42.0 |
| 17 Oct 2026 | 59.7 | 51.6 |
| 18 Oct 2026 | 57.4 | 51.7 |
| 19 Oct 2026 | 66.2 | 65.5 |
| 20 Oct 2026 | 74.9 | 73.9 |
| 21 Oct 2026 | 78.3 | 77.7 |
| 22 Oct 2026 | 91.8 | 78.9 |
| 23 Oct 2026 | 108.7 | 74.1 |
| 24 Oct 2026 | 50.4 | 60.7 |
Jammu was above the EPA's daily limit of 35 µg/m³ on 43 of those 45 days. On 29 of them the average was high enough for the EPA to call it "Unhealthy", the category where it says the general public, not only people with asthma or heart and lung problems, may start to feel it. Its worst day was 23 October, which averaged 109 µg/m³ (an AQI of 188). It rained the next day, and the average dropped to 50 - rain is about the only thing that cleans the air quickly, and it doesn't last.
Srinagar started off in better shape and got worse faster. Its average went from 37 µg/m³ in the last three weeks of September to 56 in October, up by more than half. It was over the EPA limit on 33 of the 45 days, and its worst day was 6 October at 79 µg/m³ (AQI 168). Its best day, 14 October, averaged 15. That was still only "Moderate".
Daily averages hide the spikes, so here is every hour.
The worst single hour in Jammu was 8:30 to 9:30 pm on 23 October, at 174 µg/m³. One bad hour isn't the same thing as a bad day (that's why the EPA's categories are built on 24-hour averages), but the bad hours weren't rare. Jammu spent 613 of its 1,081 hours above 55.4 µg/m³, the line where "Unhealthy" starts. That is more than half of the time. Srinagar spent 359 hours above it, about a third.
On their own, September and October can't tell you how bad the coming months will get. For that, you have to look at the rest of the year.
The rest of the year
September and October look bad on their own. They look different next to the rest of the year. Our records for both cities start on 18 January, so here is every month since then.
The cleanest month in both cities was April - 27 µg/m³ in Jammu and 16 in Srinagar. After that, it got worse. Srinagar's average went up every single month from April to October; Jammu's dipped once, in June, and climbed the rest of the time. None of this happened suddenly. By the time people start posting about the air in late October, it has been getting worse for six months.
And it hasn't peaked yet. Last January and February were worse than anything since. Jammu averaged 120 µg/m³ in the second half of January and 113 in February, close to twice what it is this October. Every complete day we recorded in Jammu between 18 January and the end of February was either "Unhealthy" or "Very unhealthy", and the worst of them, 1 February, averaged 164 µg/m³ (an AQI of 239). Srinagar's worst day was 19 January, at 142.
Across the whole year, Jammu hasn't had a single day the EPA would call "Good". We have 272 complete days of data for it, and not one of them was clean. Srinagar had 11, five of them in April. The cleanest of all was 23 January, at 3.8 µg/m³, the day heavy snow fell across the valley - snow cleans the air the same way rain does.
One caveat about January. Our first sensor in Jammu went up on 16 January, and it was offline for six days later that month, so Jammu's January figure comes from about seven days of readings from one sensor. Its data from February onwards is complete.
Last winter
Our records for the whole network start in January, but one sensor goes back further. Kanipora, on the edge of Srinagar, went up on 4 October 2025, and until July it was the only sensor we had in the city. Here is every month it has recorded.
On the same dates, 4 to 24 October, Kanipora averaged 83 µg/m³ last year and 62 this year. So by that measure, this October is cleaner than the last one. That would be good news if we didn't know what came after last October.
November 2025 averaged 294 µg/m³. December averaged 364, more than ten times the EPA's daily limit. Through those two months the air at Kanipora mostly kept getting worse, until 20 December averaged 571 µg/m³ and one hour that evening, from 5:30 to 6:30 pm, reached 758. Of the 88 full days we recorded between the start of November and the end of January, 46 were in the EPA's worst category, "Hazardous". Then, on 22 December, the daily average fell to 61. That was most likely snow.
These numbers come from one sensor at one spot. Kanipora might sit closer to a strong local source than other parts of the city (a cluster of houses heating with hamams would do it), so read them as what one neighbourhood breathed, not as an average for all of Srinagar. They are the same corrected readings our API uses, taken straight from the sensor's own records.
If this winter goes the way the last one did, October is the easy part.
What would help
Some of this is up to you, for this winter. Check the air before you go out; the live numbers are on breatheoss.app. In Jammu the worst time of day was the evening, from about 6:30 to 9:30 pm, and the cleanest was early afternoon. In Srinagar it was the morning until about 10:30 and then again late at night, with the afternoon being the best part of the day. If you have to be out in the bad hours, a properly fitted N95 mask does far more than a cloth one. And if you have leaves to get rid of, compost them; don't burn them.
Some of it is up to the government, and a lot of it is already written down. Jammu's own action plan says its roads need black-topping and water spraying. Srinagar's leaf-burning ban is from 2017. Both cities' plans promised a source apportionment study, a proper measurement of where the pollution comes from, and neither had one when the plans were written. Until somebody measures what is actually in the air, the percentages in those plans are guesses, and so is any money spent on them. In Kashmir, the biggest fix is also the hardest - people need a way to stay warm in winter that doesn't involve burning wood and coal in every house, and that needs electricity that doesn't cut out when it's needed most.
As for us, we are going to keep the sensors running through the winter, keep every reading public through our API, and keep adding sensors where we can. If you want one on your roof, or you just want to help, find us on Discord or email [email protected].
By March, people will probably stop talking about the air again. We will still be posting the numbers.